Finance
My work at Freedom Finance centred on supporting the Business Development team. I worked with Analytics to turn monthly performance data into presentation packs for lender and partner meetings, and created guidelines and infographics to help the team communicate information clearly.
Business Development Packs
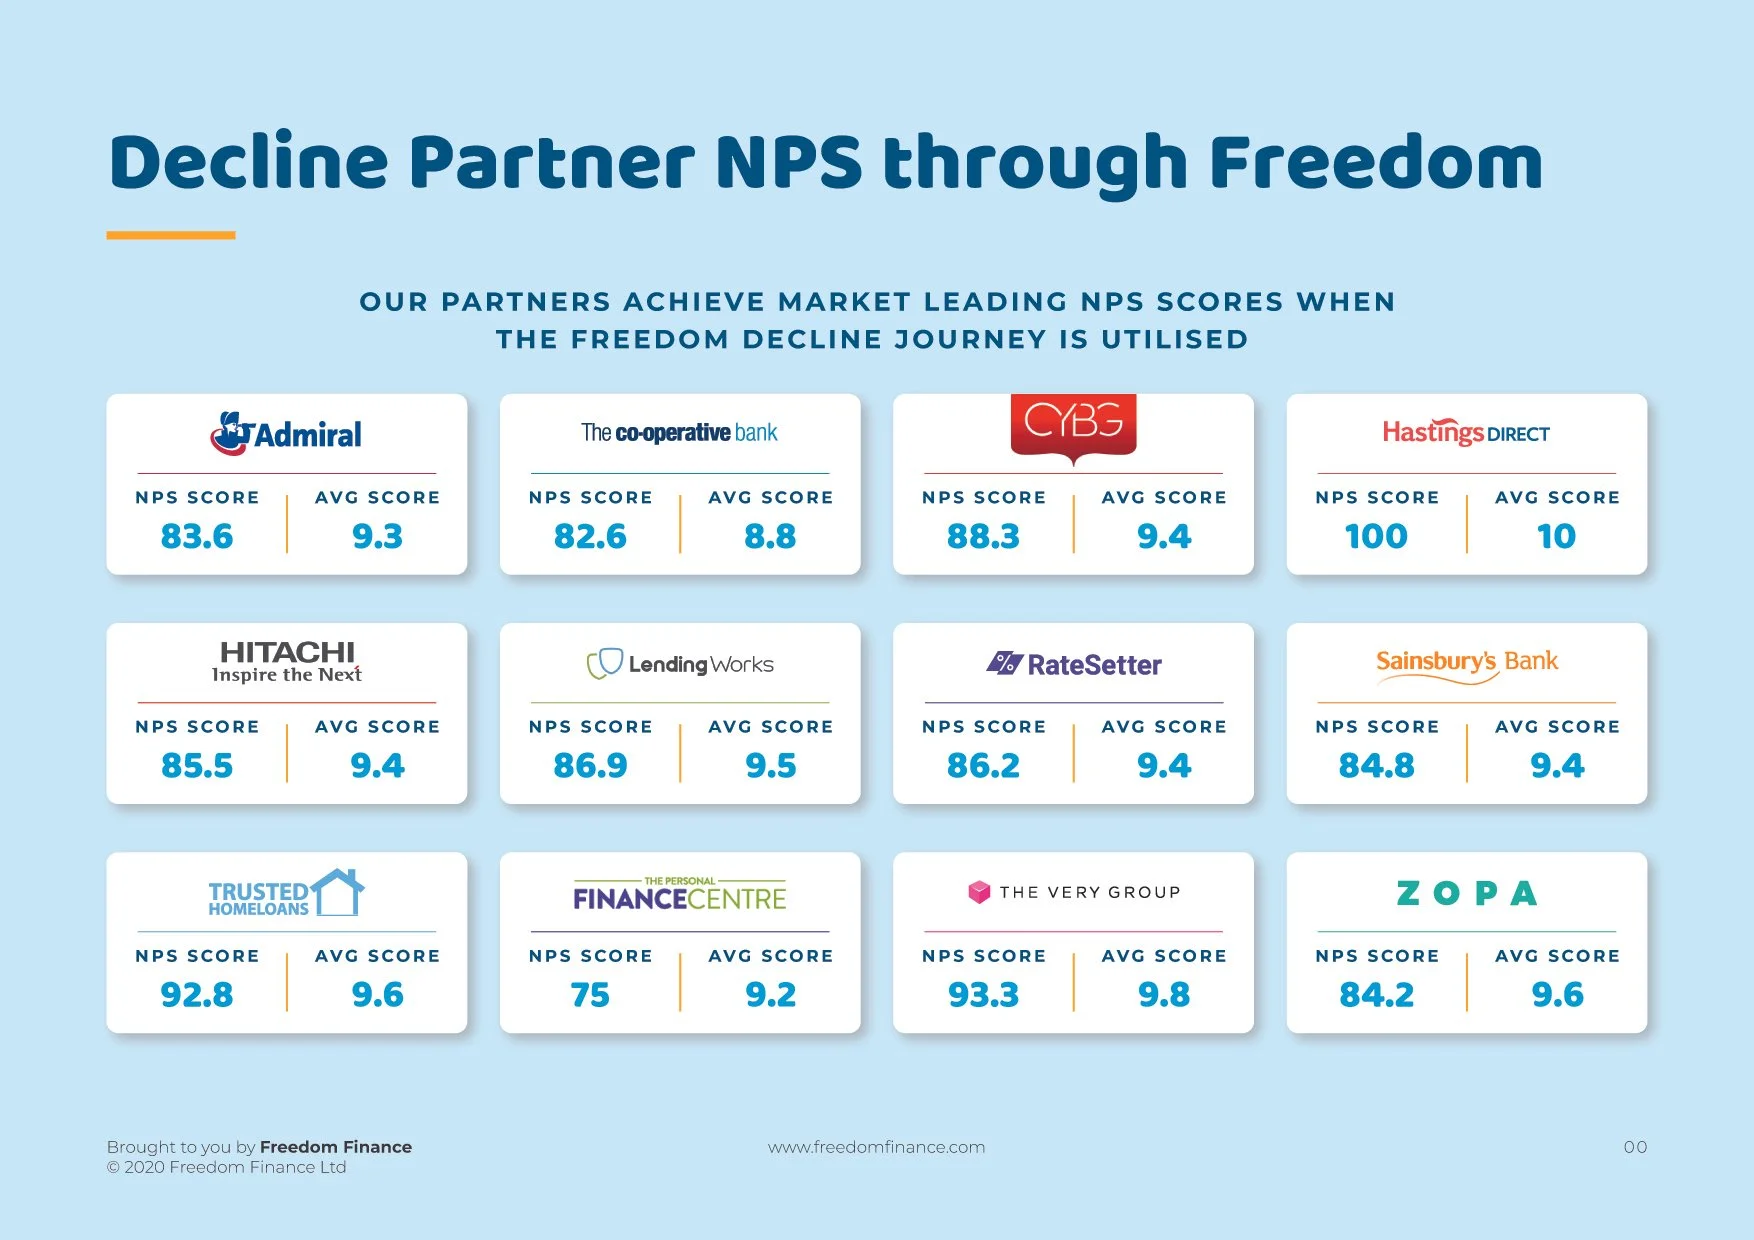
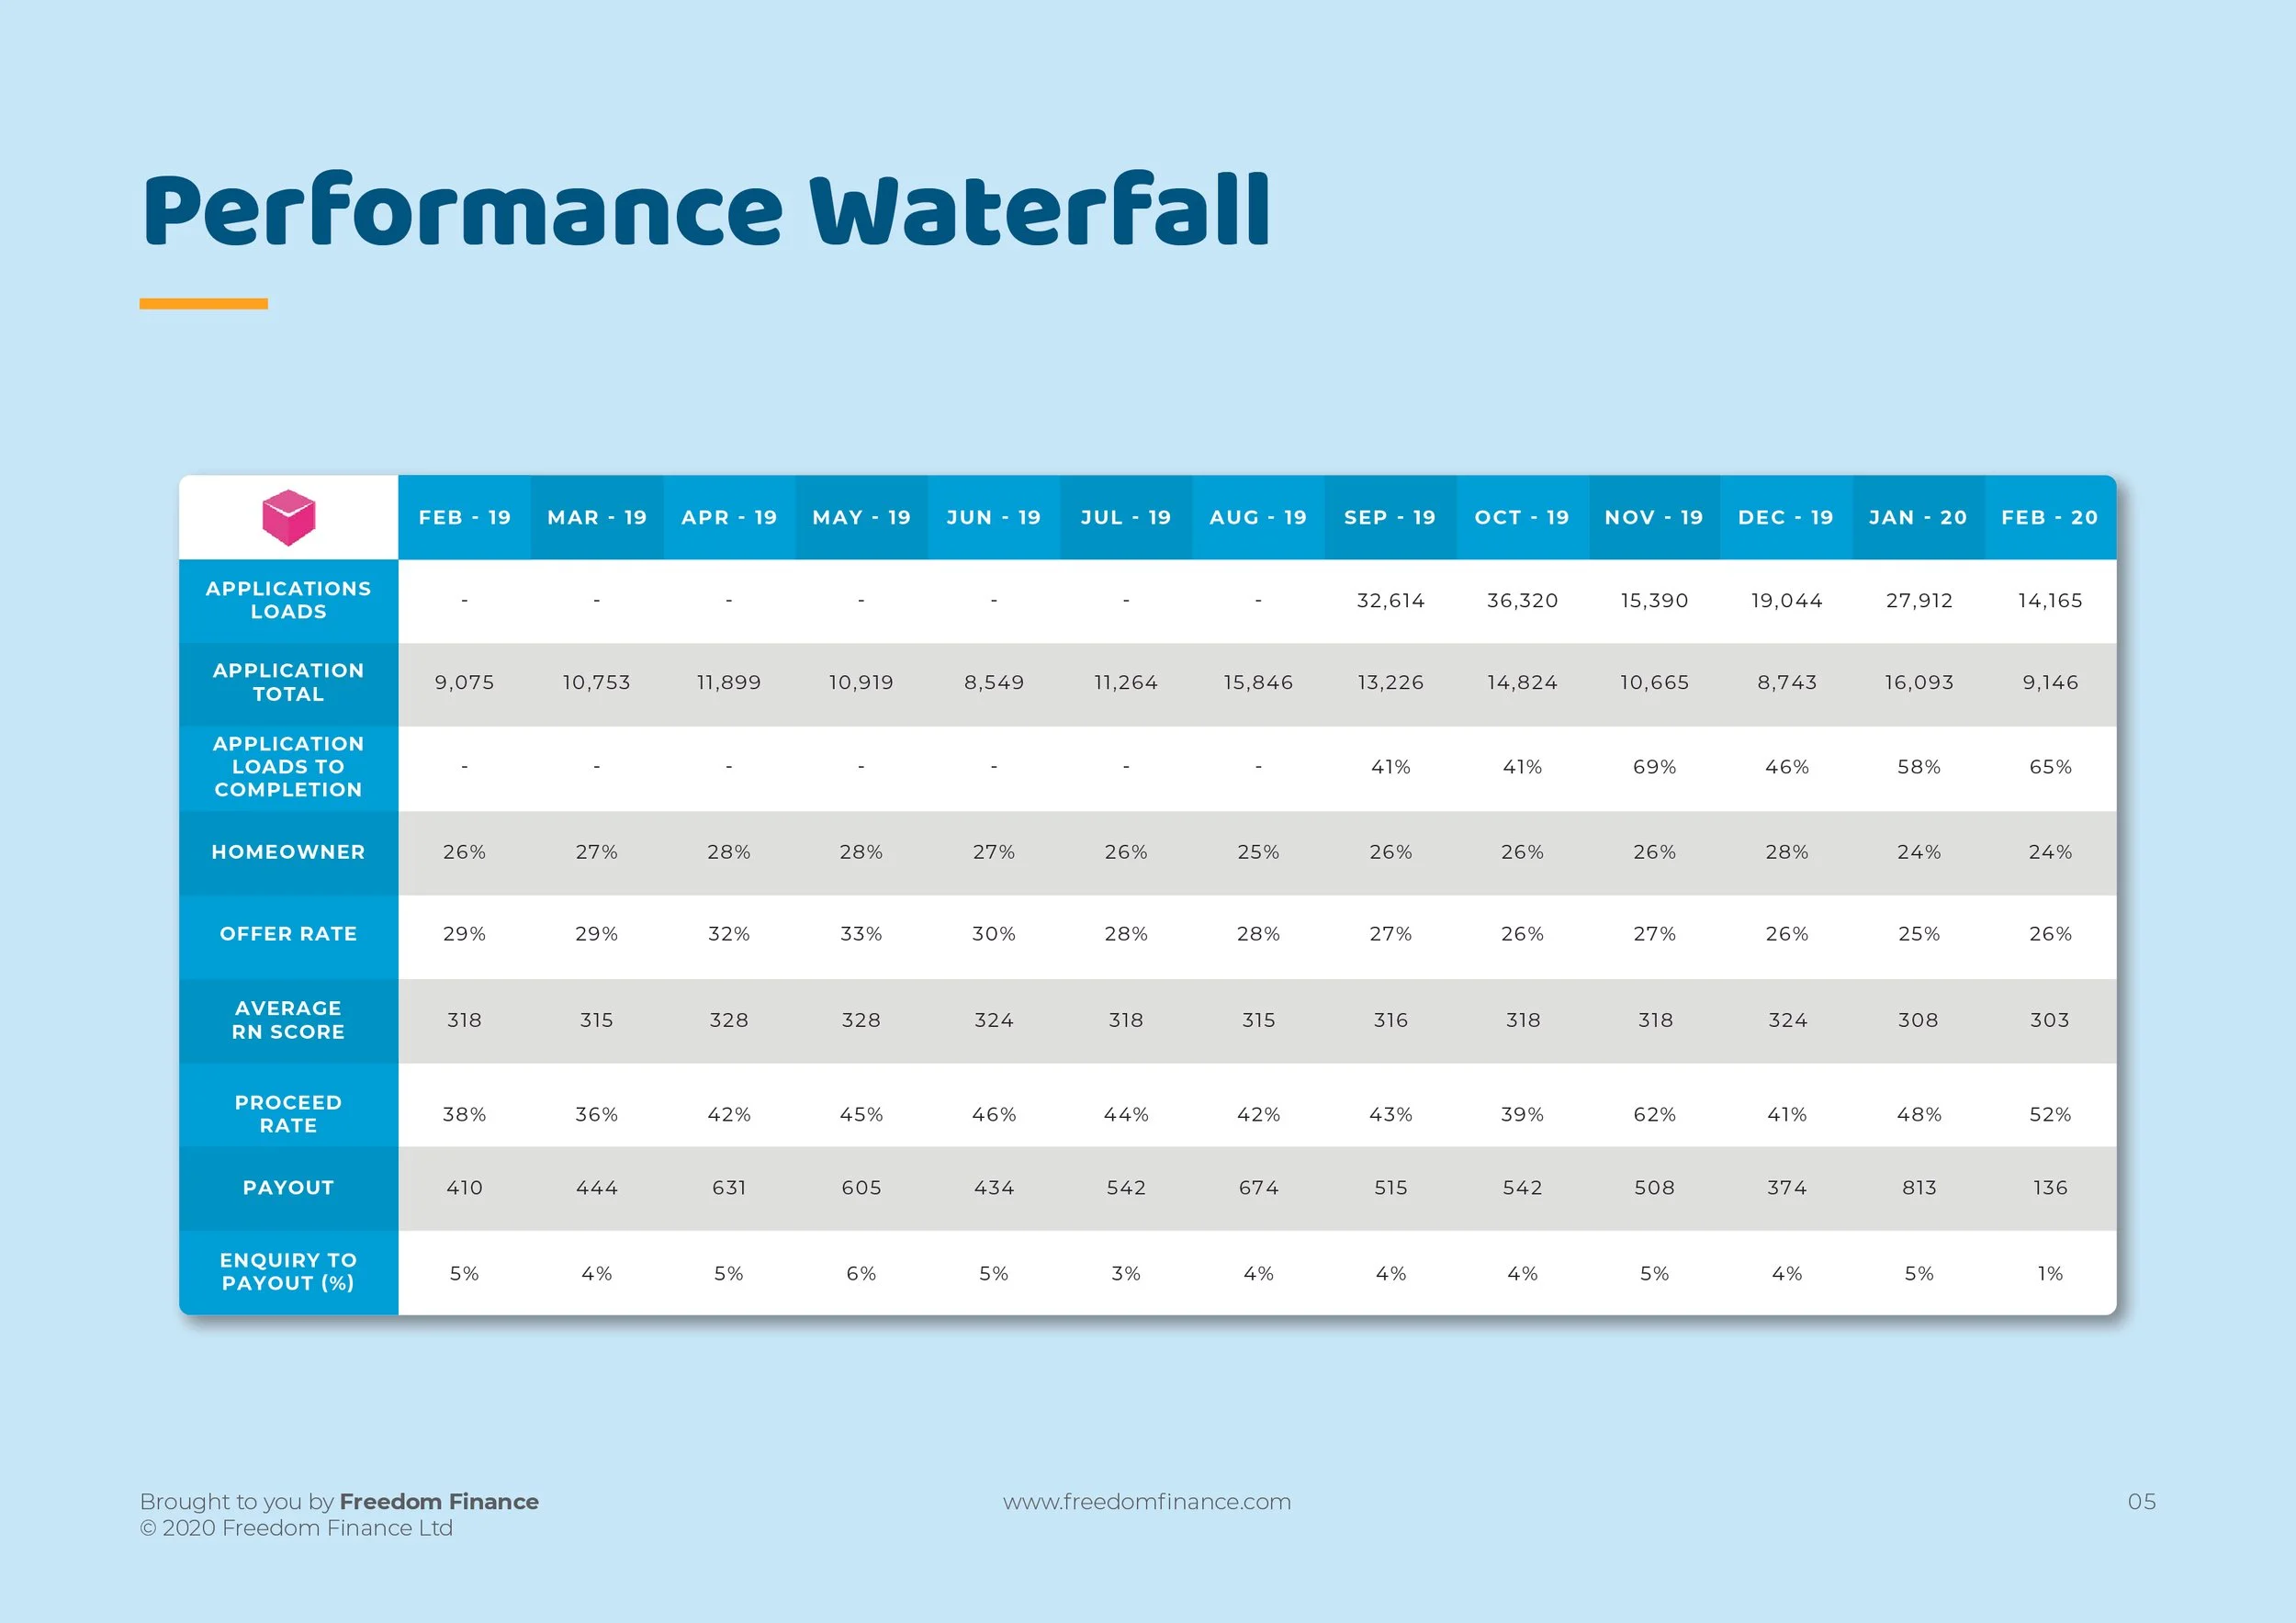
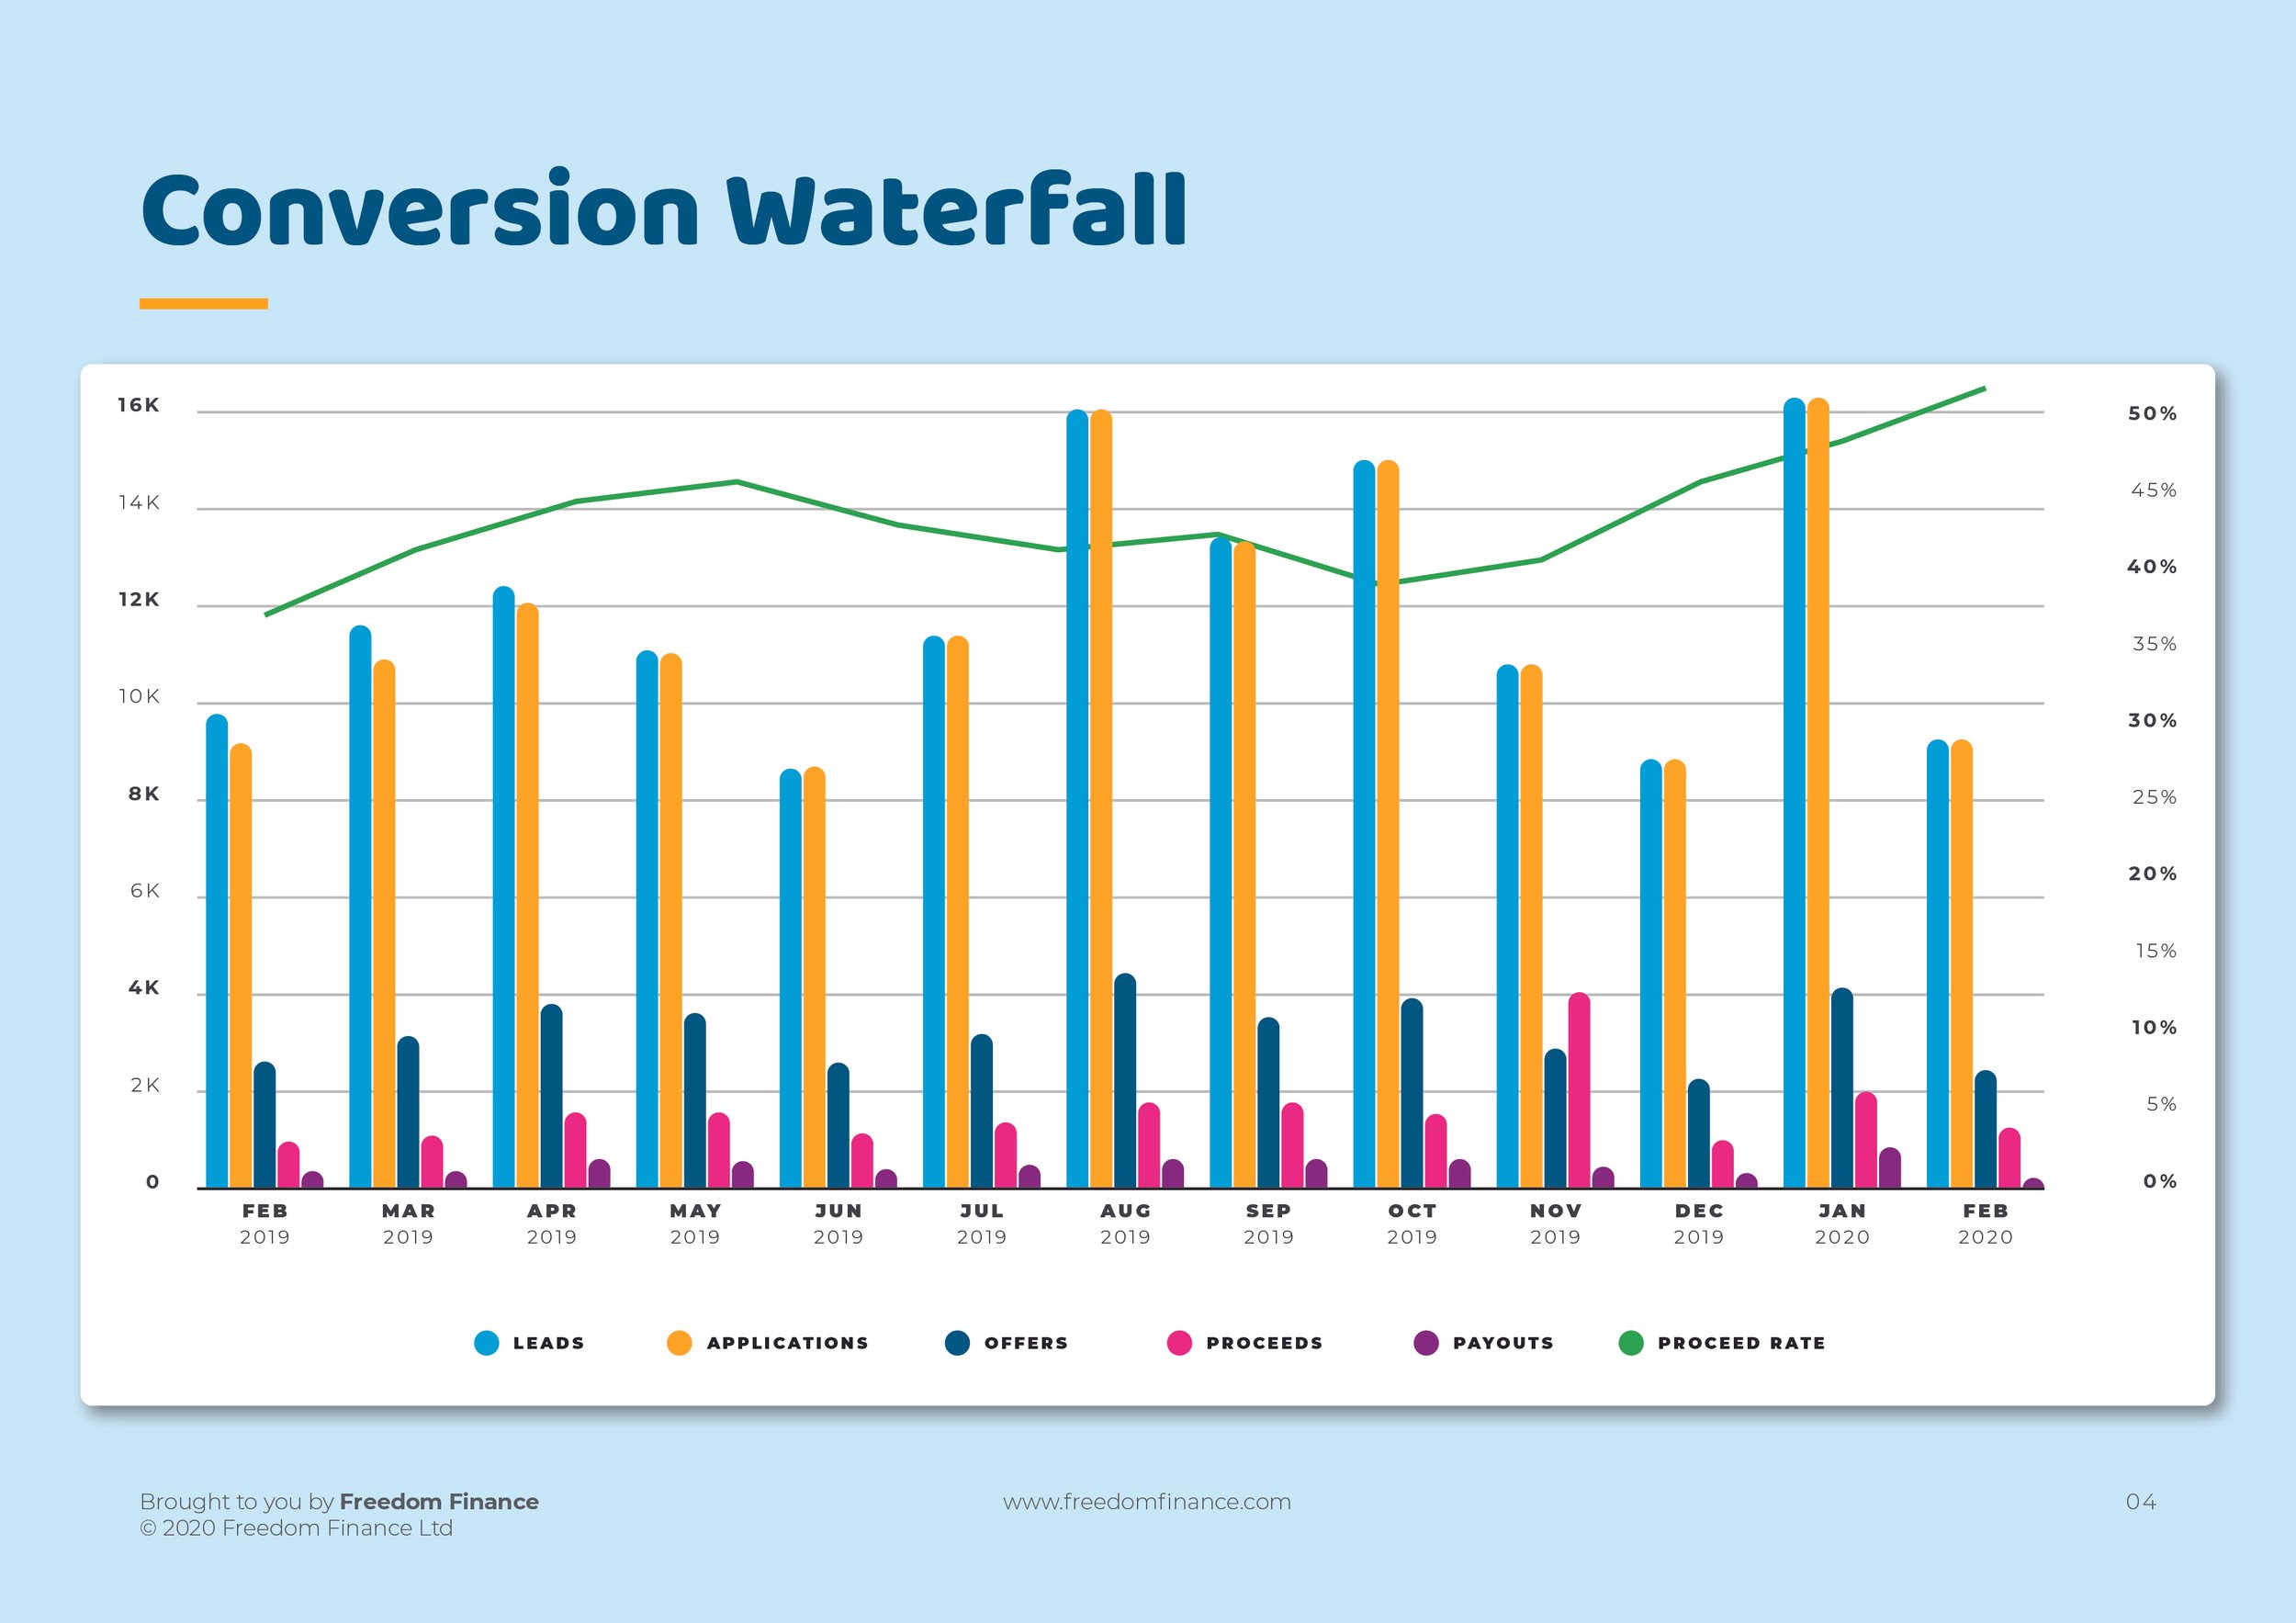
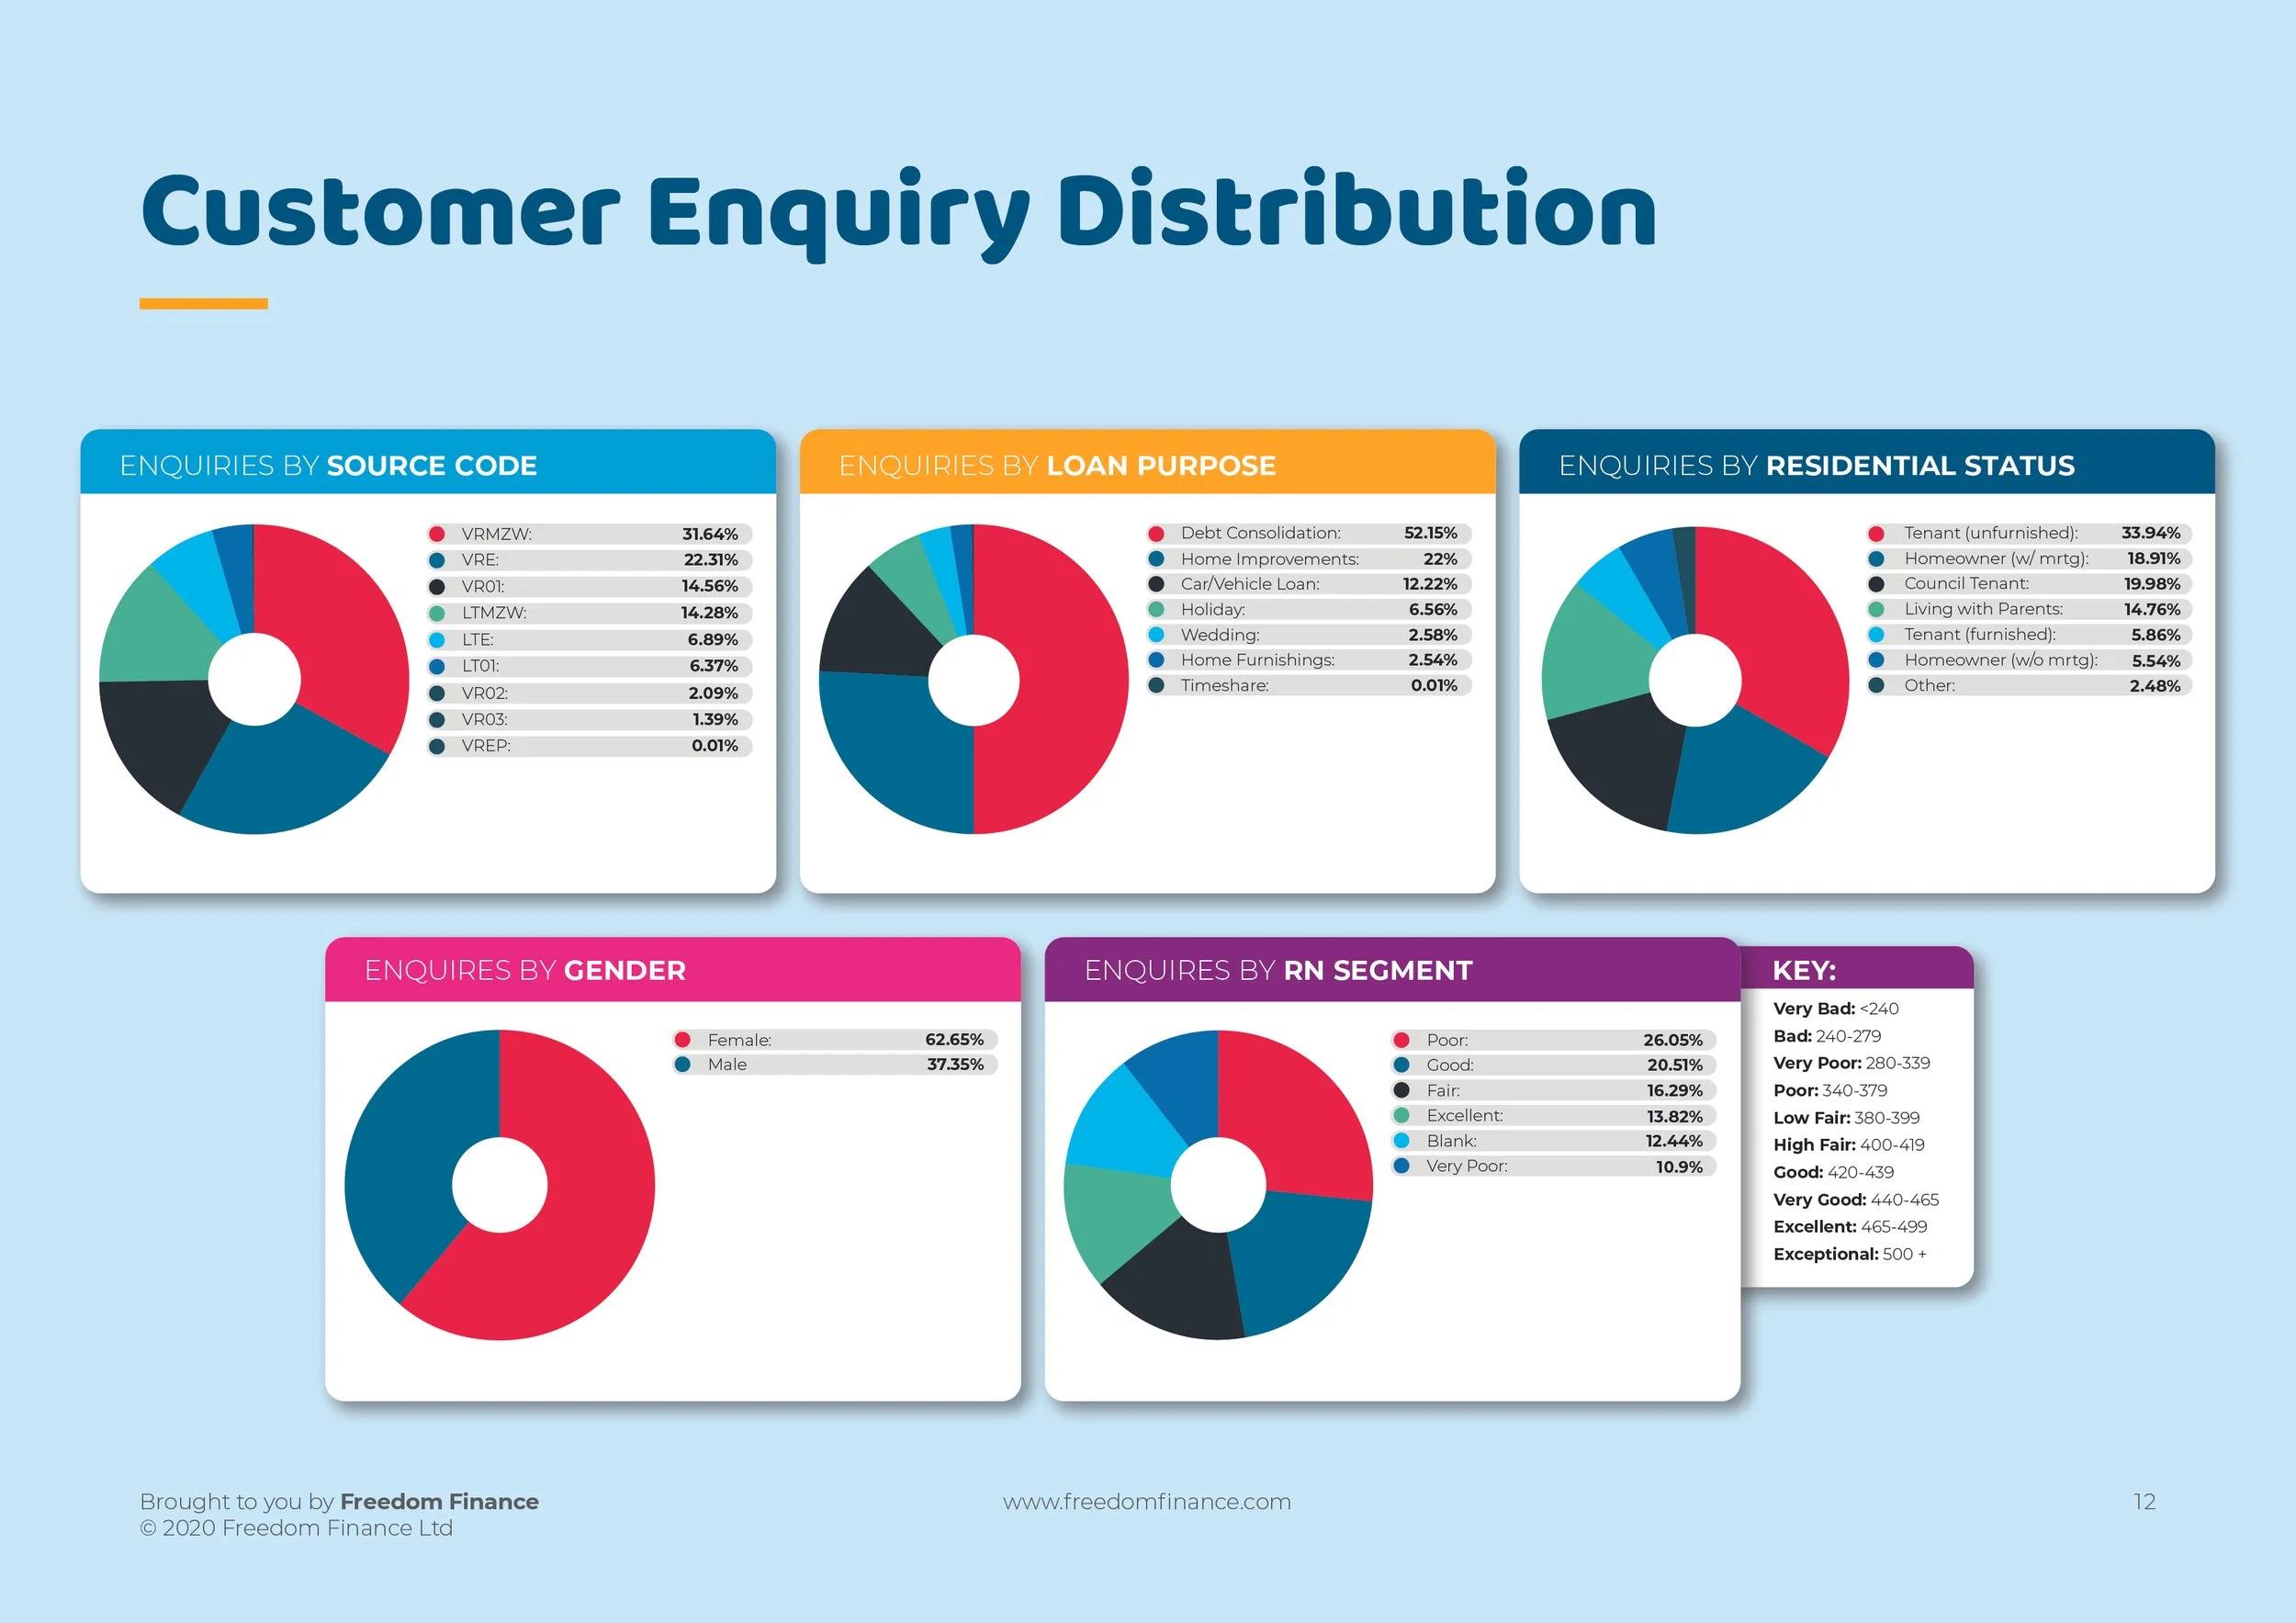
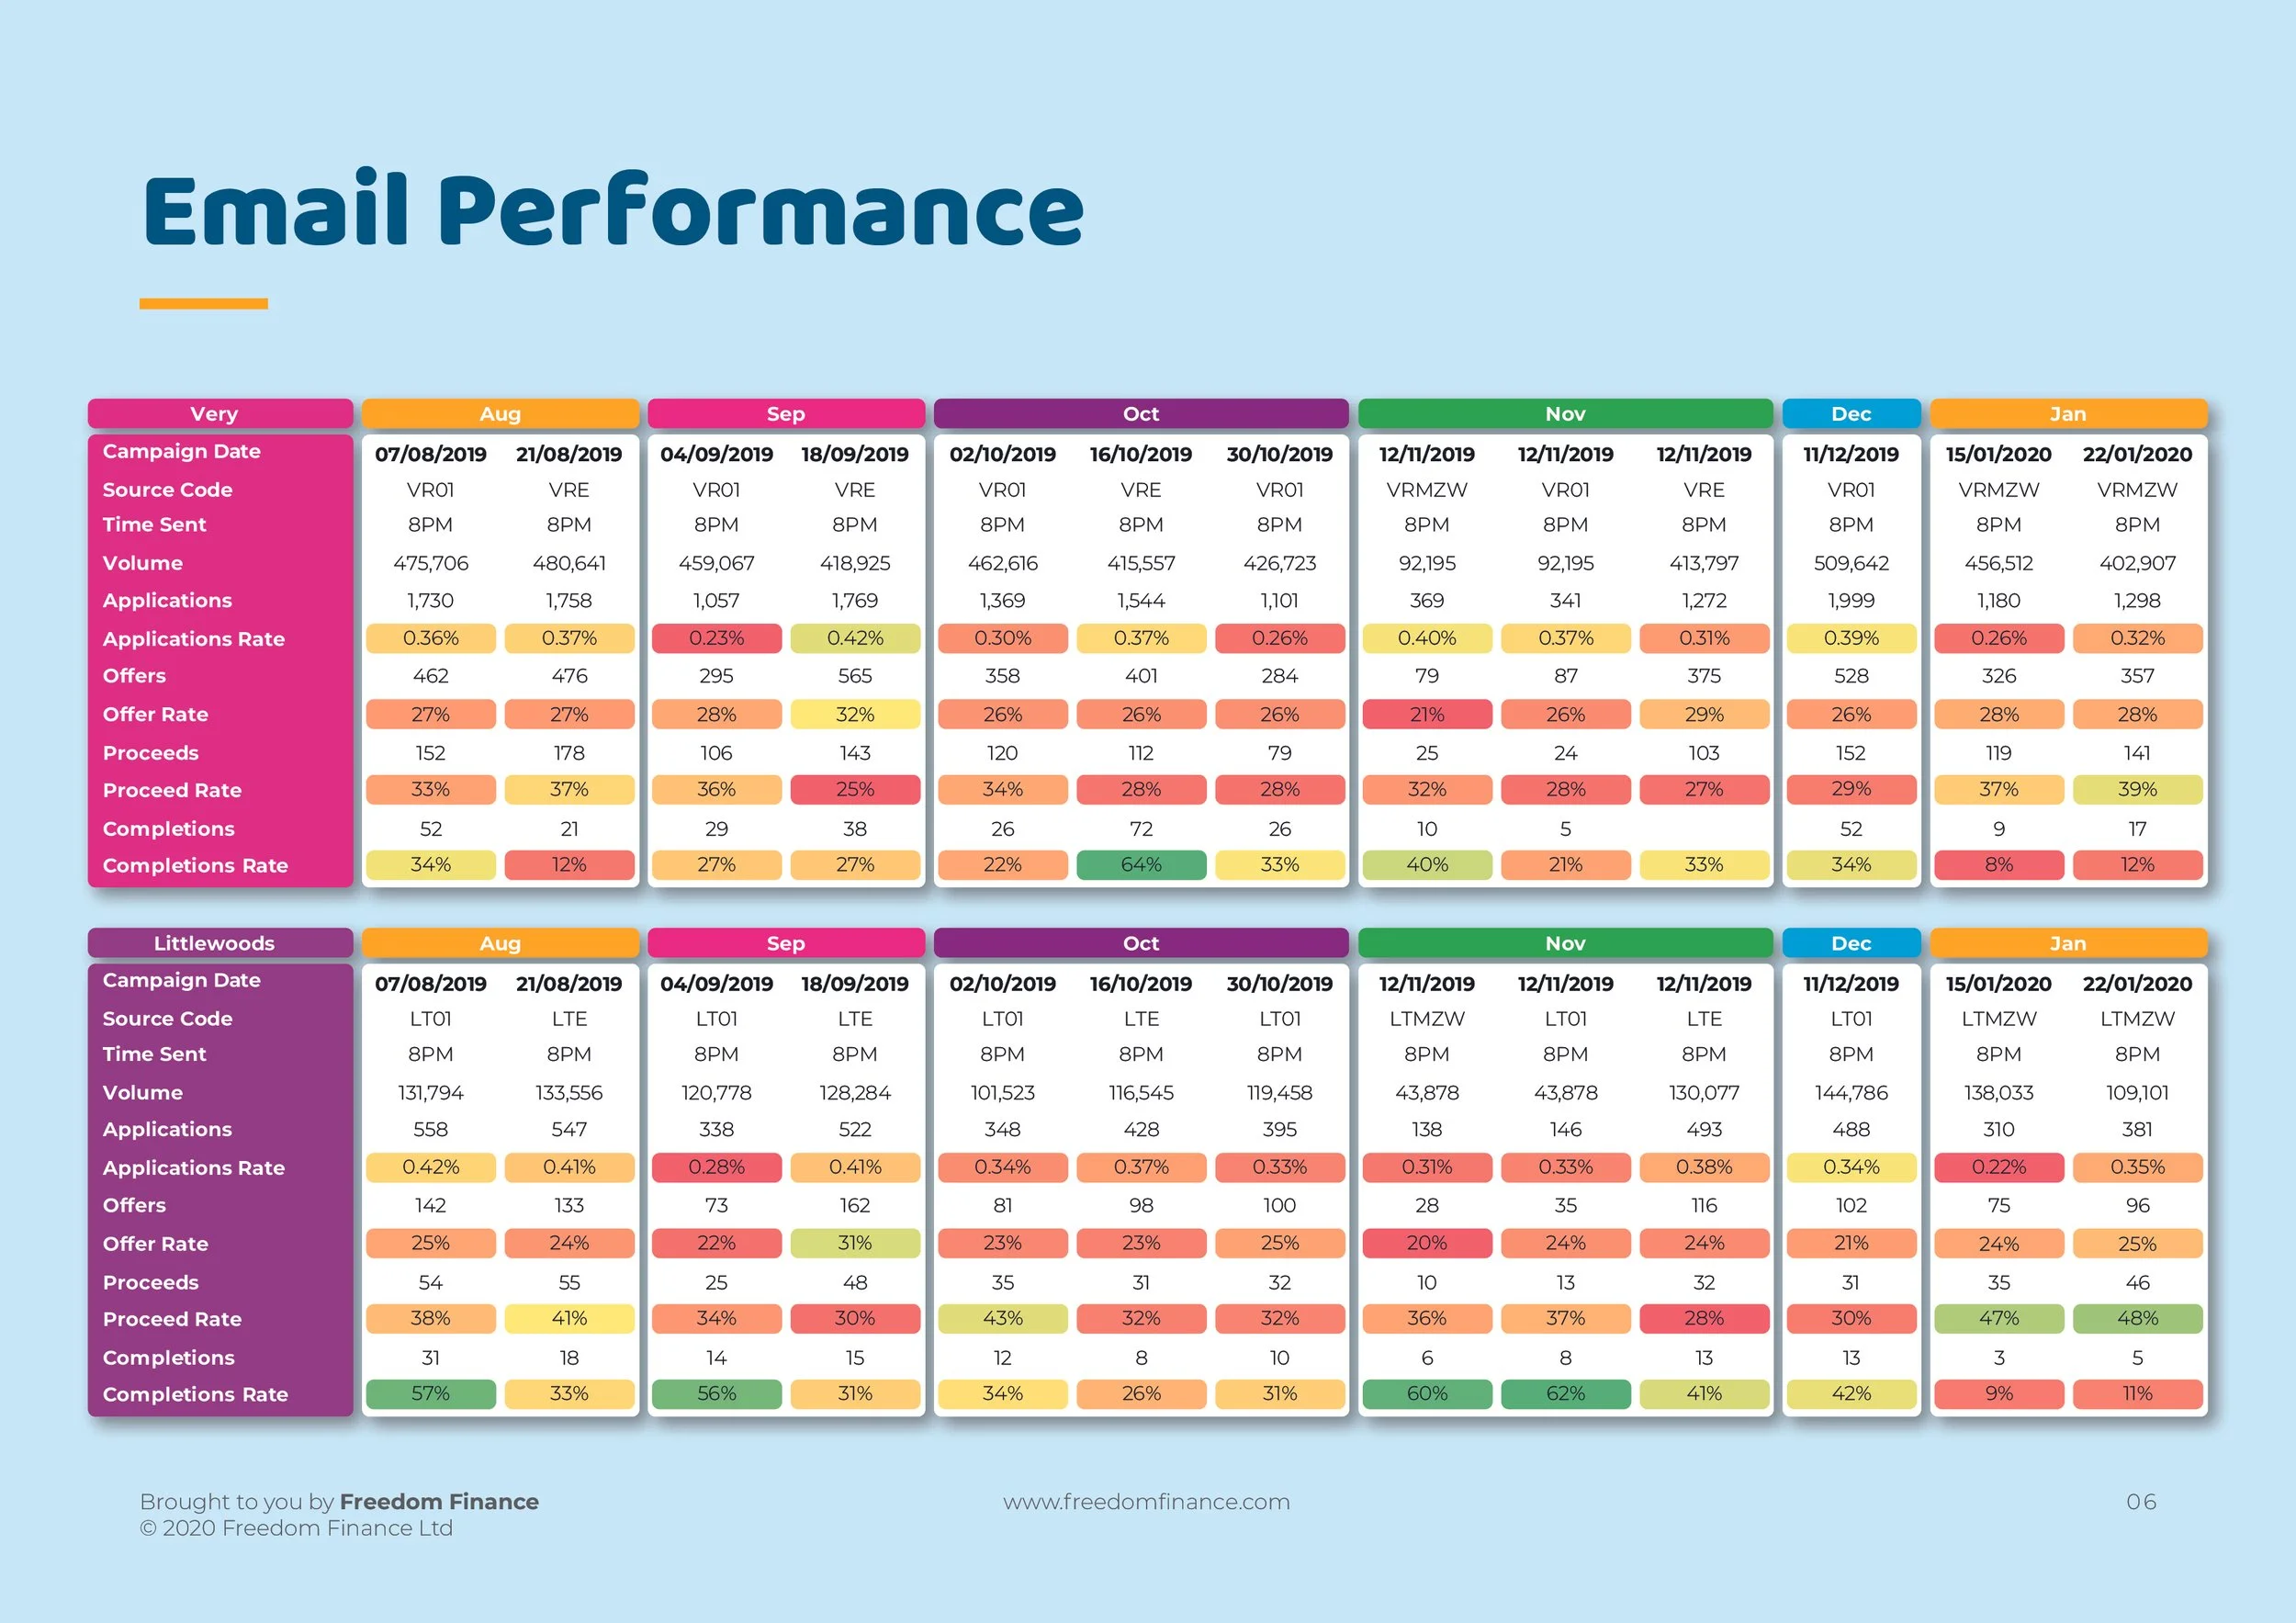
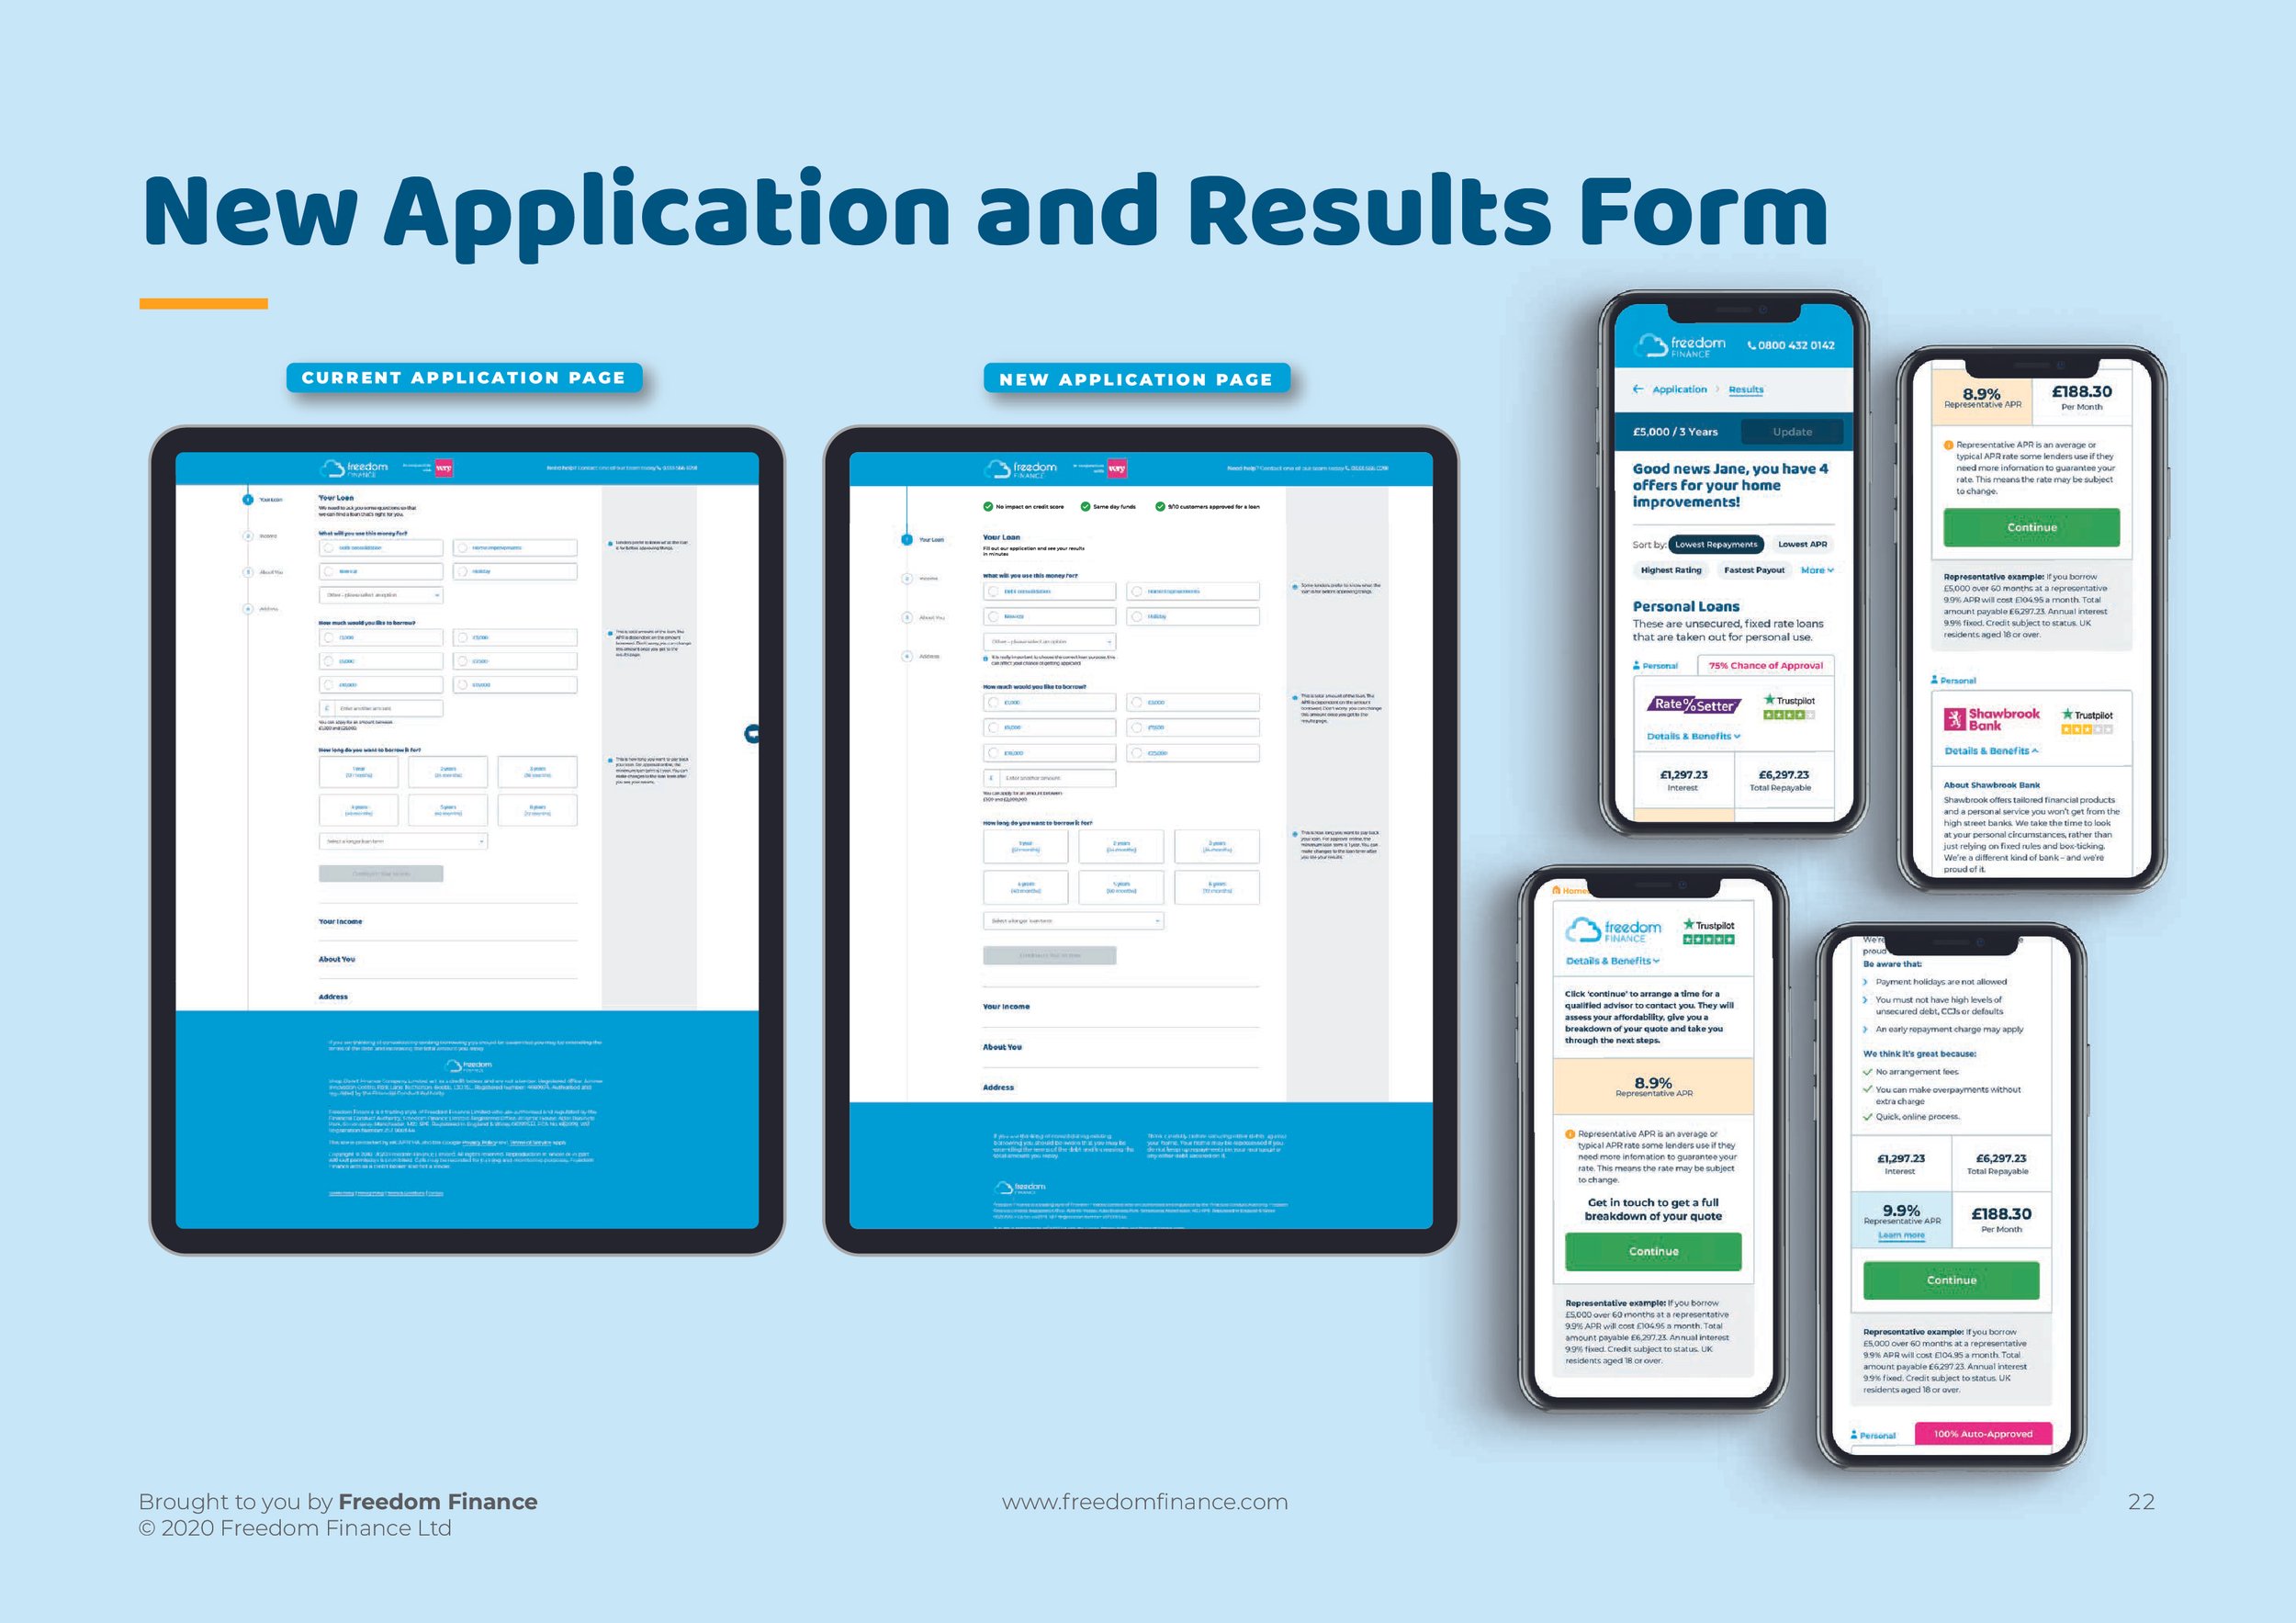
Each monthly pack brought together trading performance, lender comparisons and customer feedback. I worked with the Analytics team to organise that information into charts, tables and summaries the team could use in meetings. The Very Group review shown here is one example, combining detailed reporting with a consistent layout across the pack.
My role: presentation design and data visualisation.
Presentation Guidelines
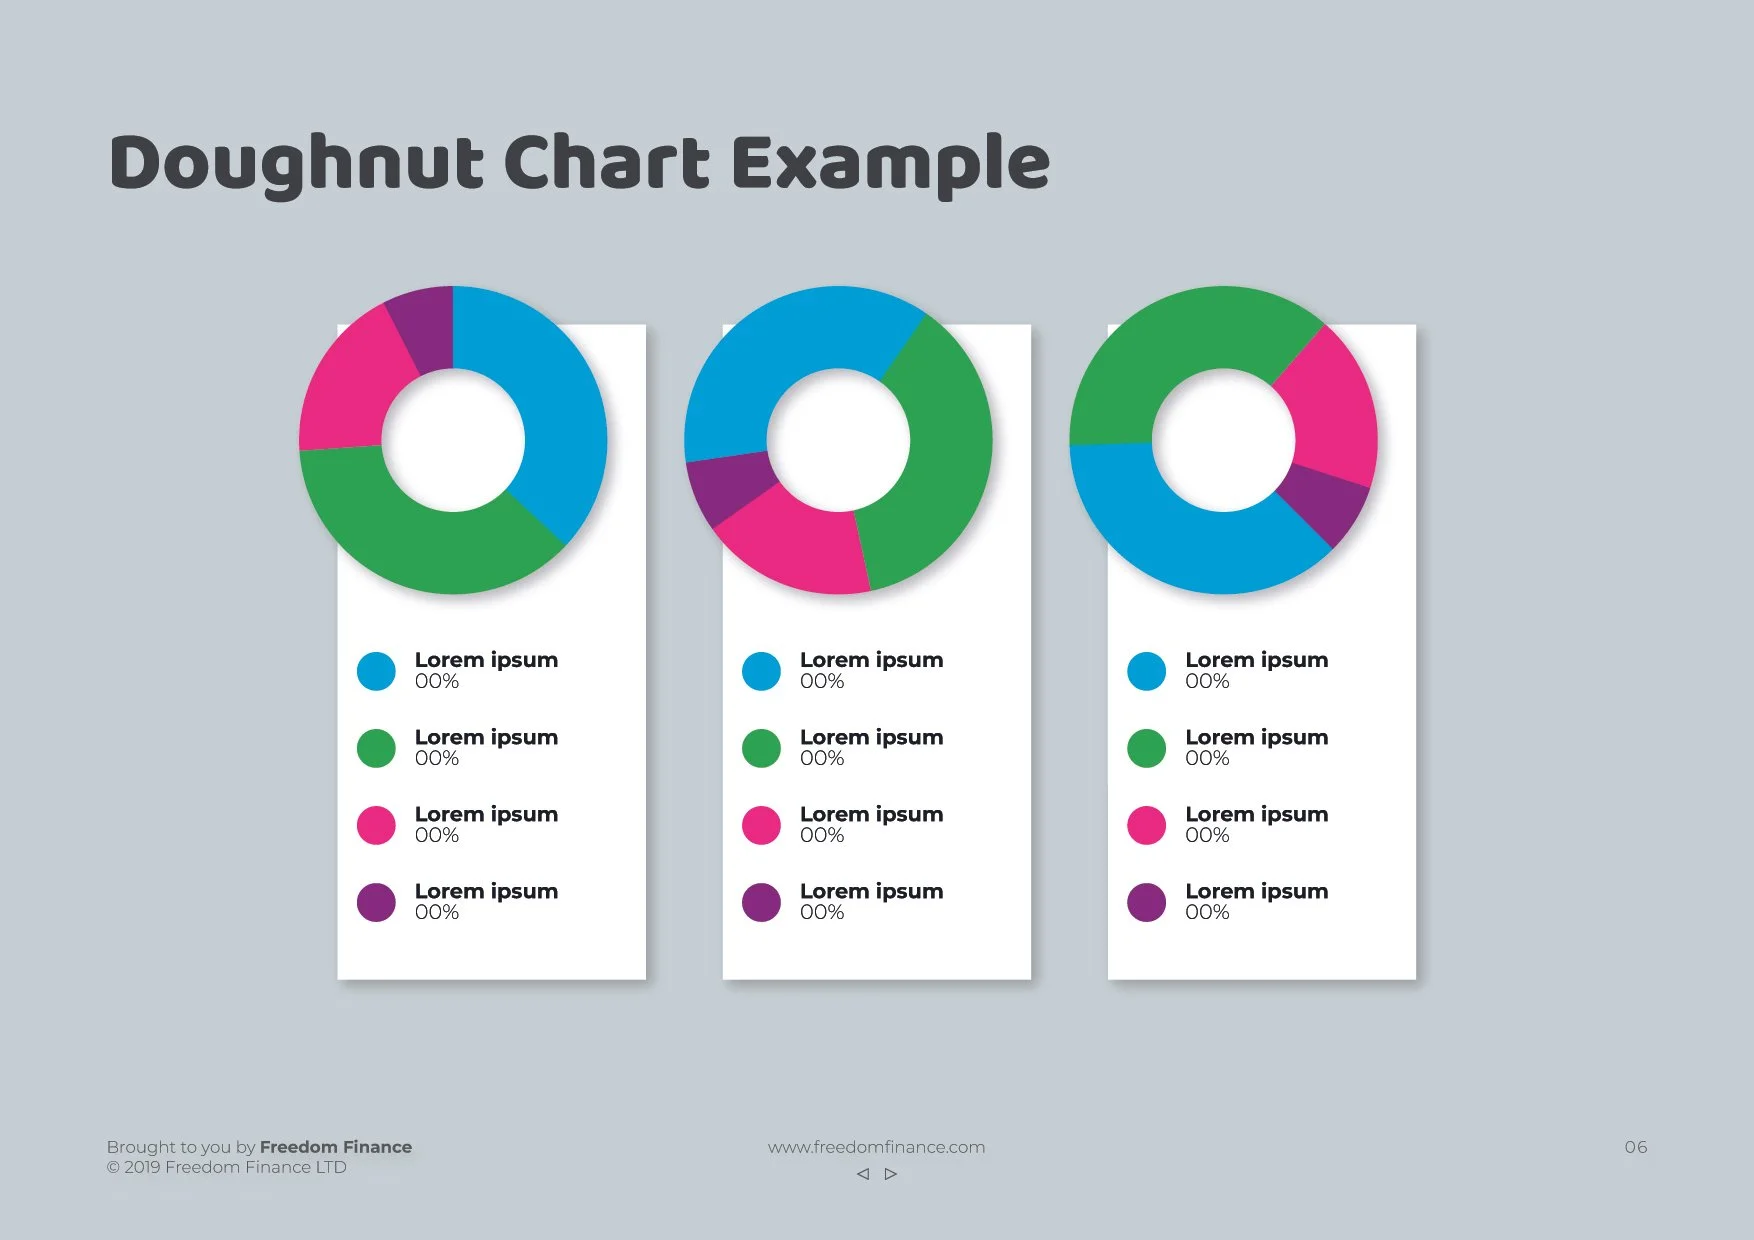
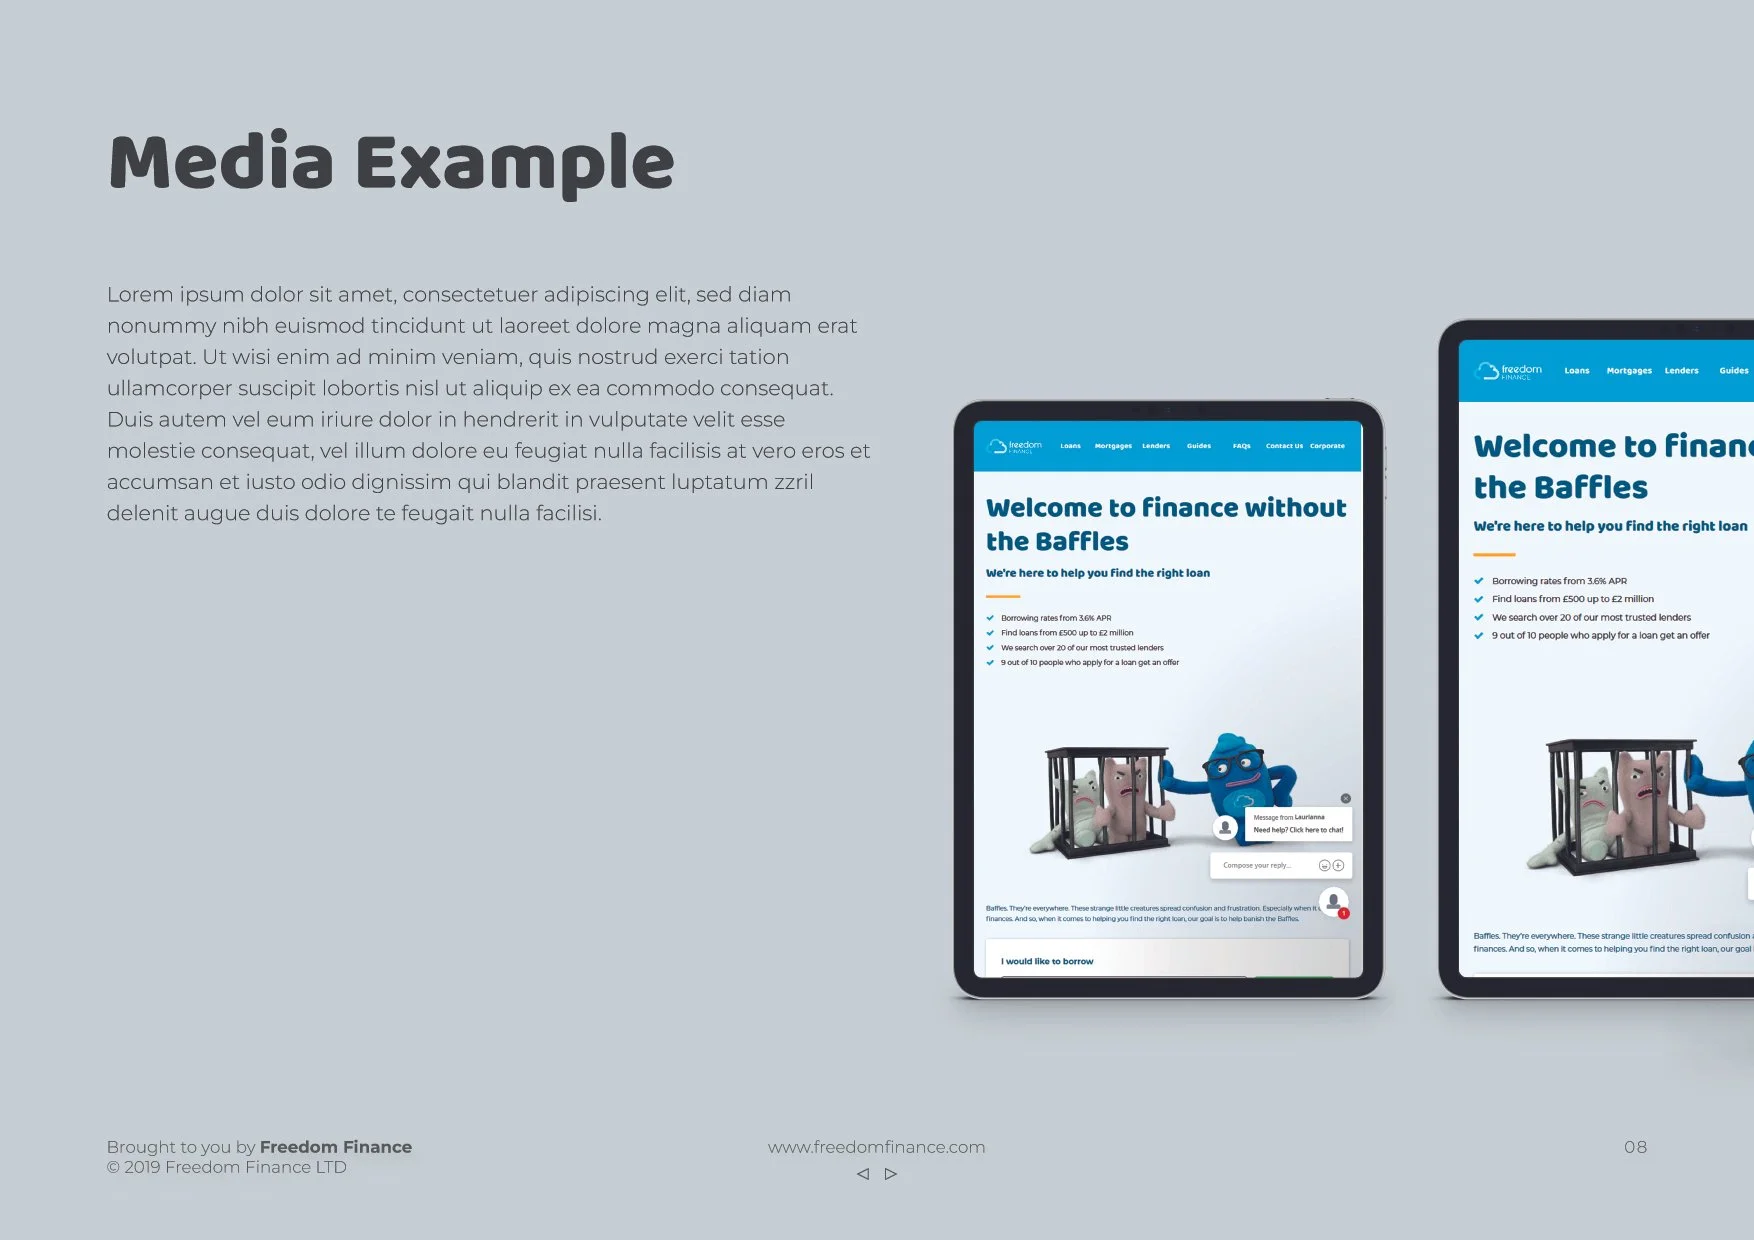
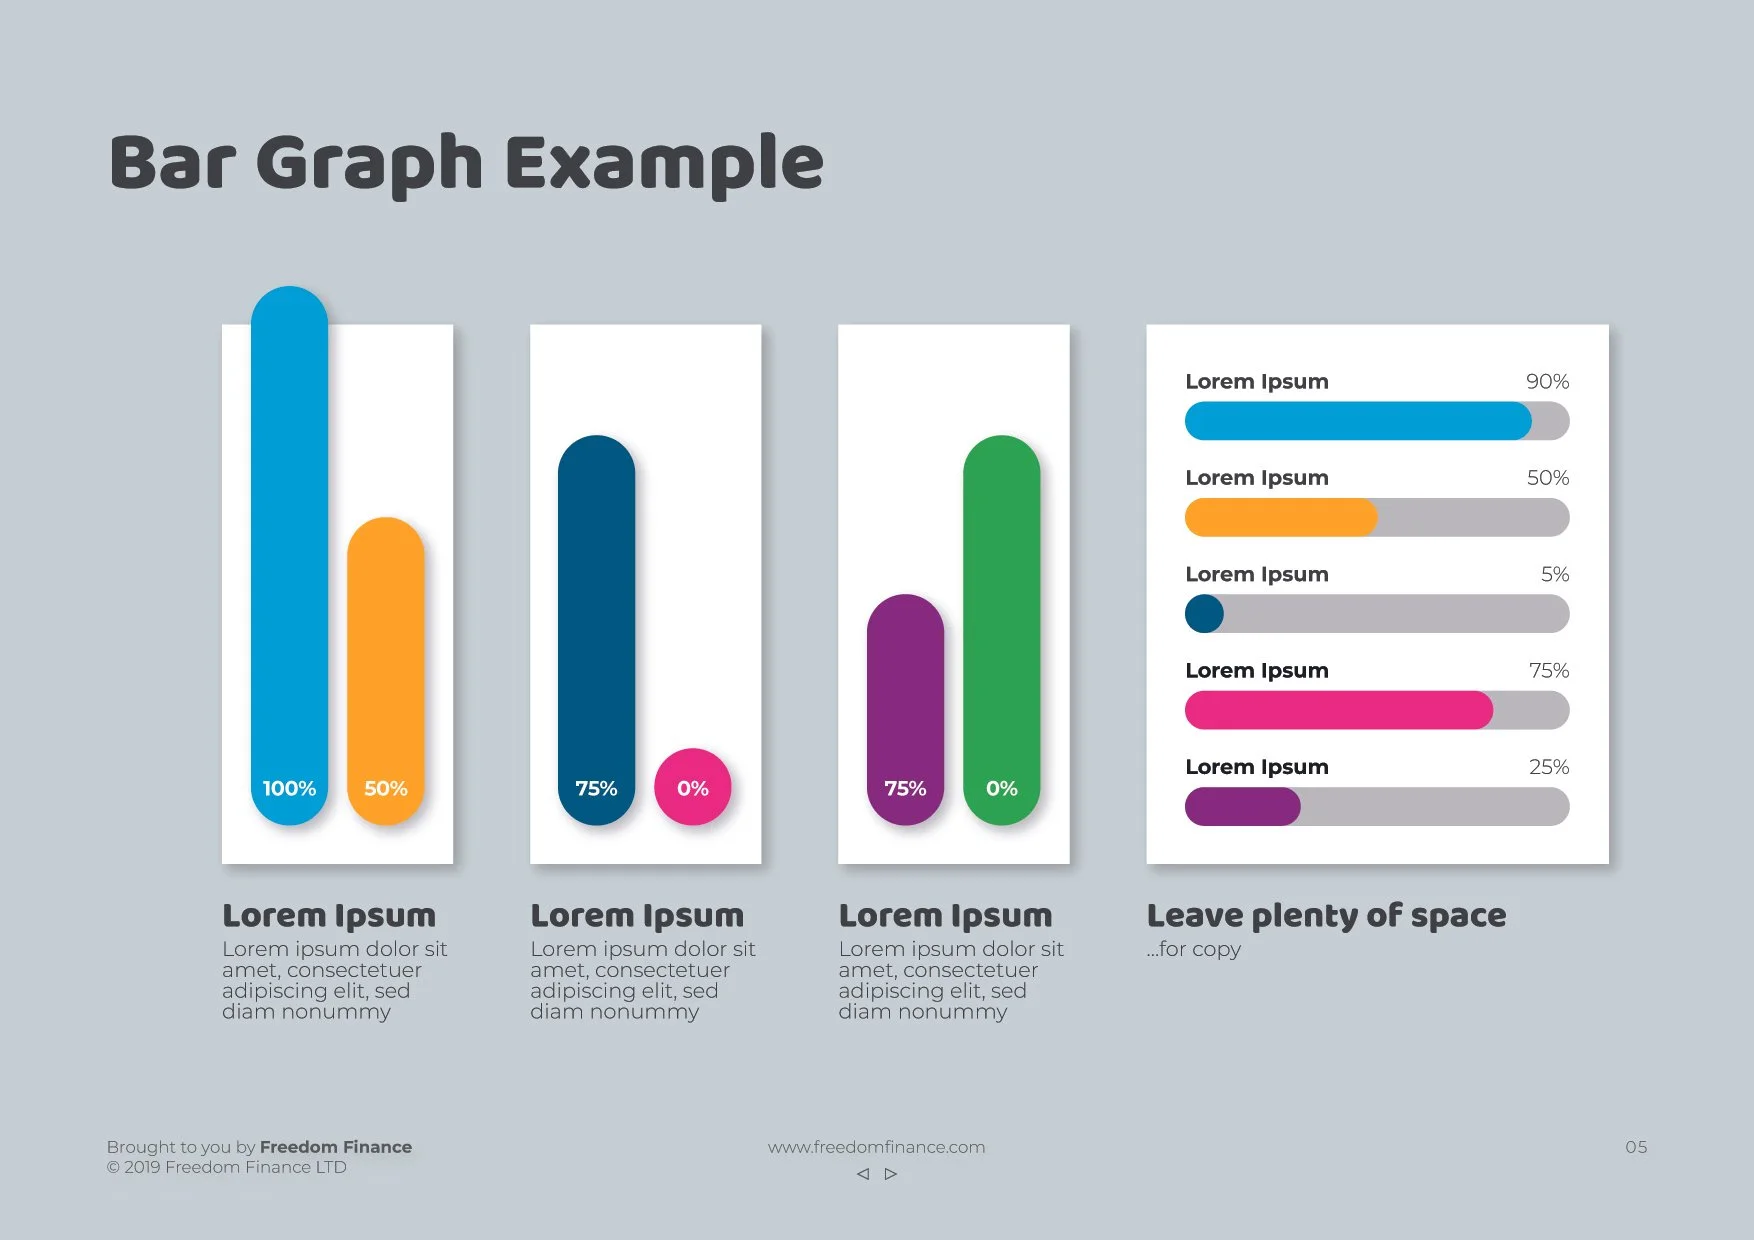
I developed a set of presentation guidelines to give the packs a consistent structure. They covered typography, page layouts, charts and image treatment, with a grid to keep the content organised as information changed from month to month.
My role: presentation guidelines and template design.

Customer Insight
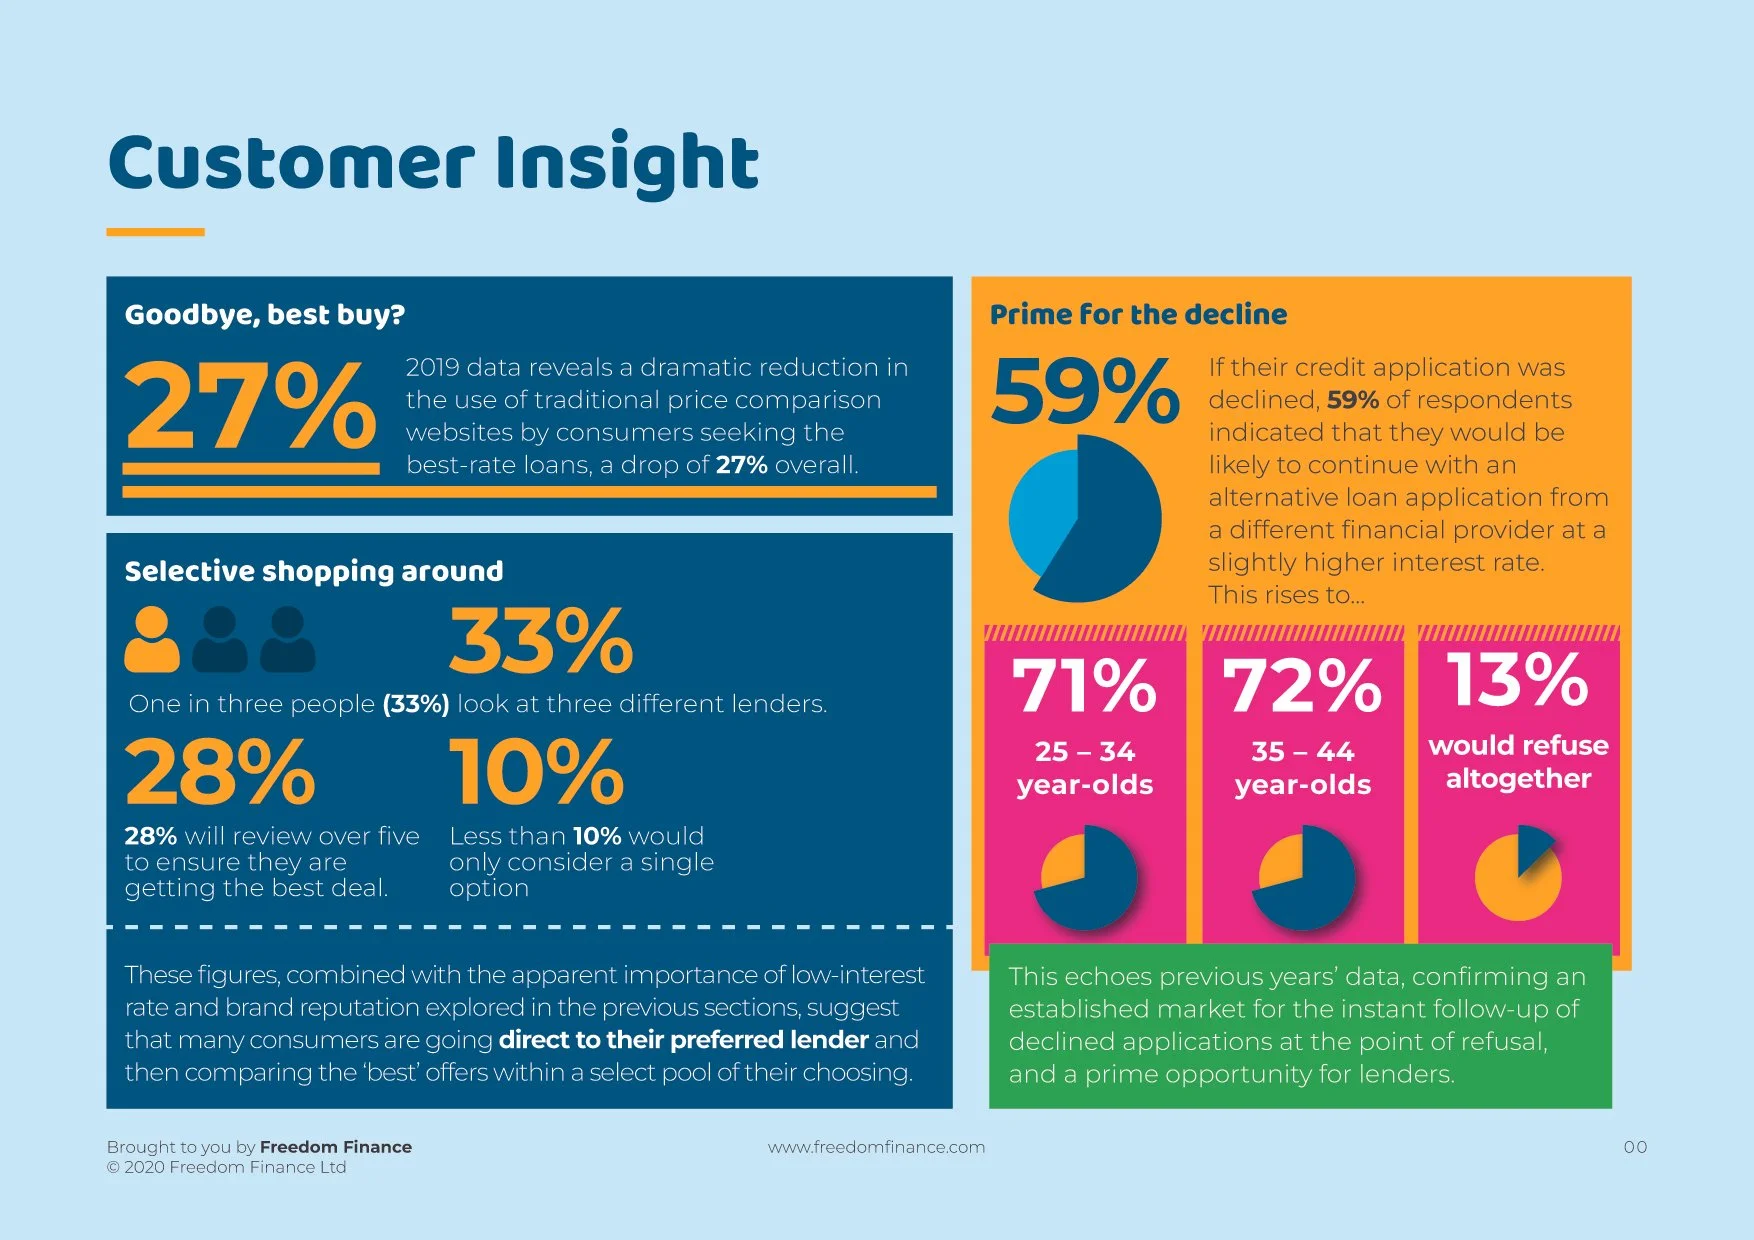
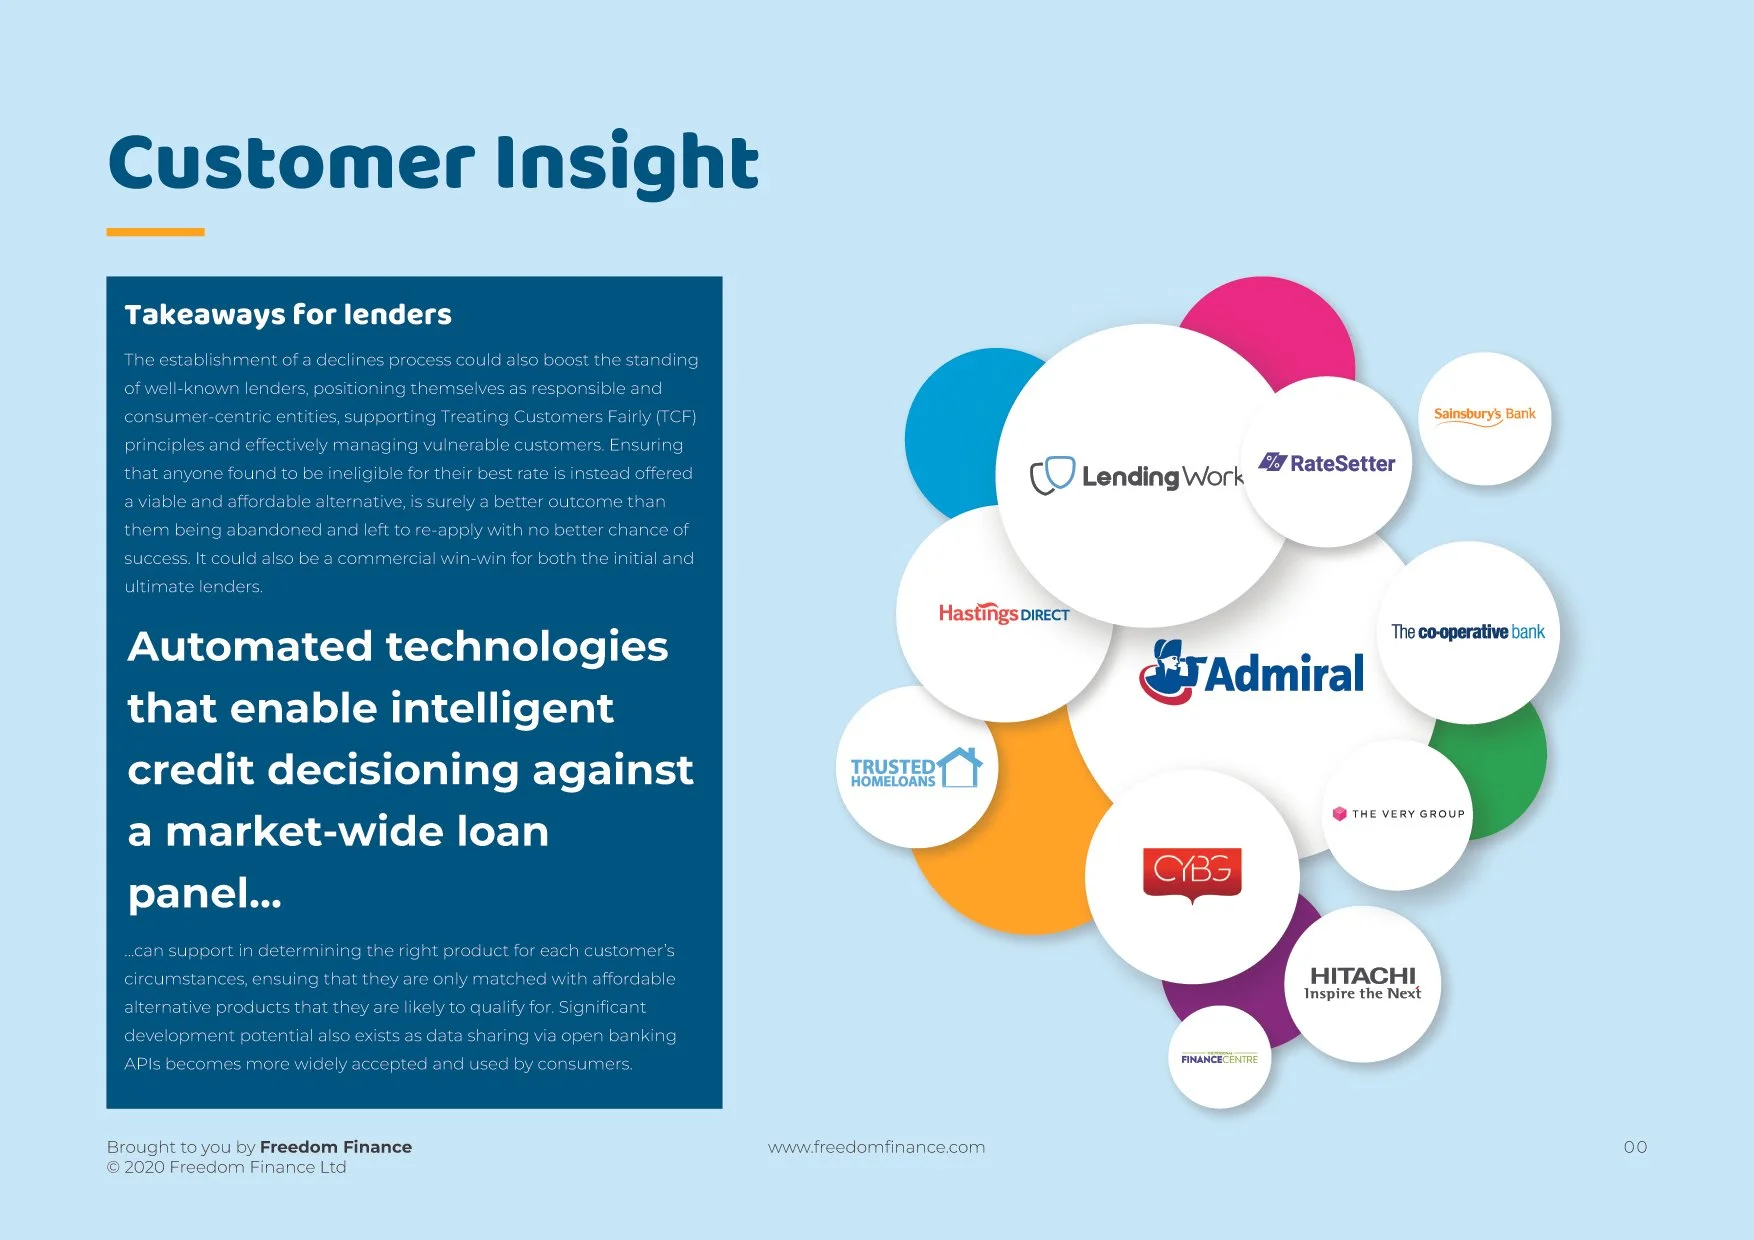
I designed infographics around customer borrowing behaviour, including how people compared lenders and what they might do after a declined application. I used prominent figures, simple charts and short summaries to make the research easier to scan and discuss.
My role: infographic design and data visualisation.